Data
This Influenza Deaths l Source – CDC, U.S Population l Source – U.S Census Bureau, Influenza Visit l Source – CDC

A medical staffing agency wanted to provide temporary workers to clinics and hospitals on an as-needed basis. Therefore I analyzed the flu trends in the USA in order to provide more accurate recommendations on how many workers to send to each state.
This Influenza Deaths l Source – CDC, U.S Population l Source – U.S Census Bureau, Influenza Visit l Source – CDC
Data Cleaning, Data Transformation and Integration (* Excel: PivotTables, VLOOKUP, Power Point), Data Profiling and Integrity, Designing a Data Research Project, Data Visualization and Storytelling (Tableau)

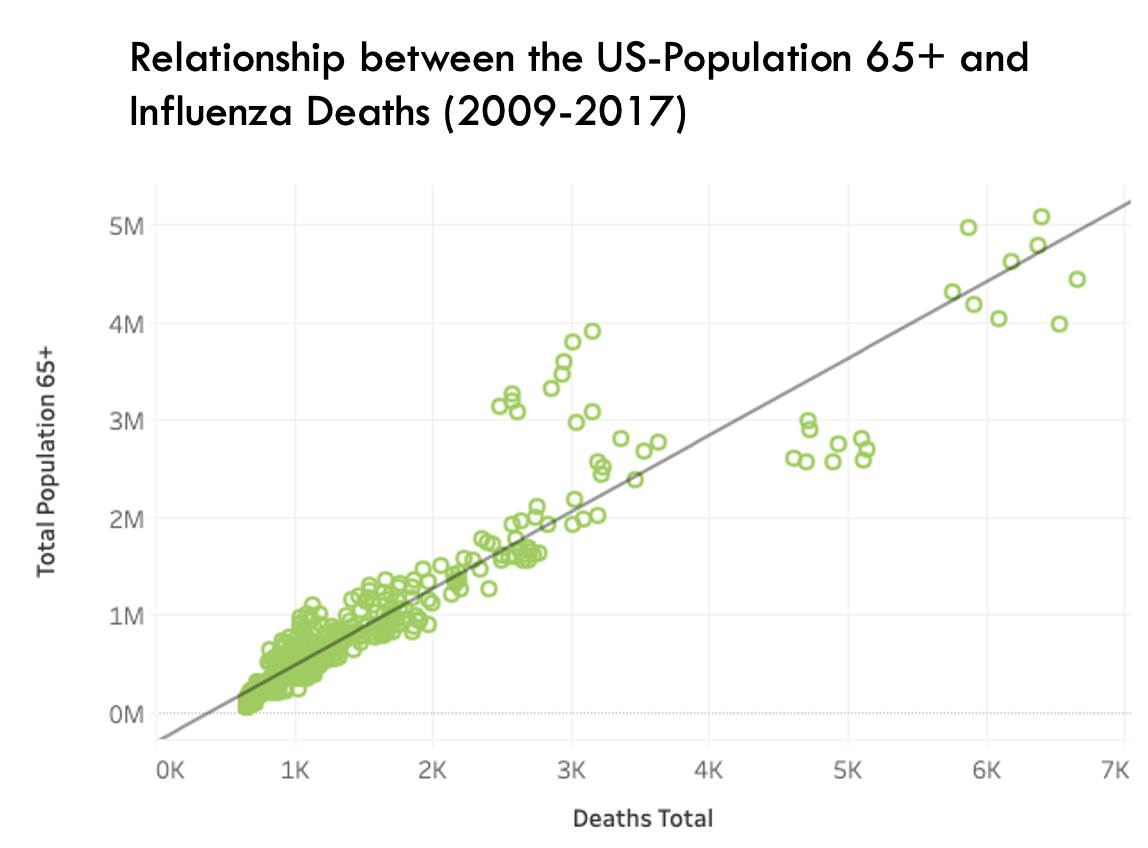
Which age group has the highest number of influenza deaths?
The 65+ age-groups have the highest flu death propotion per age group. They are more likely to suffer fatalities from the flu. The correlation between the number of 65+ citizens per state and the number of influenza deaths is significant.
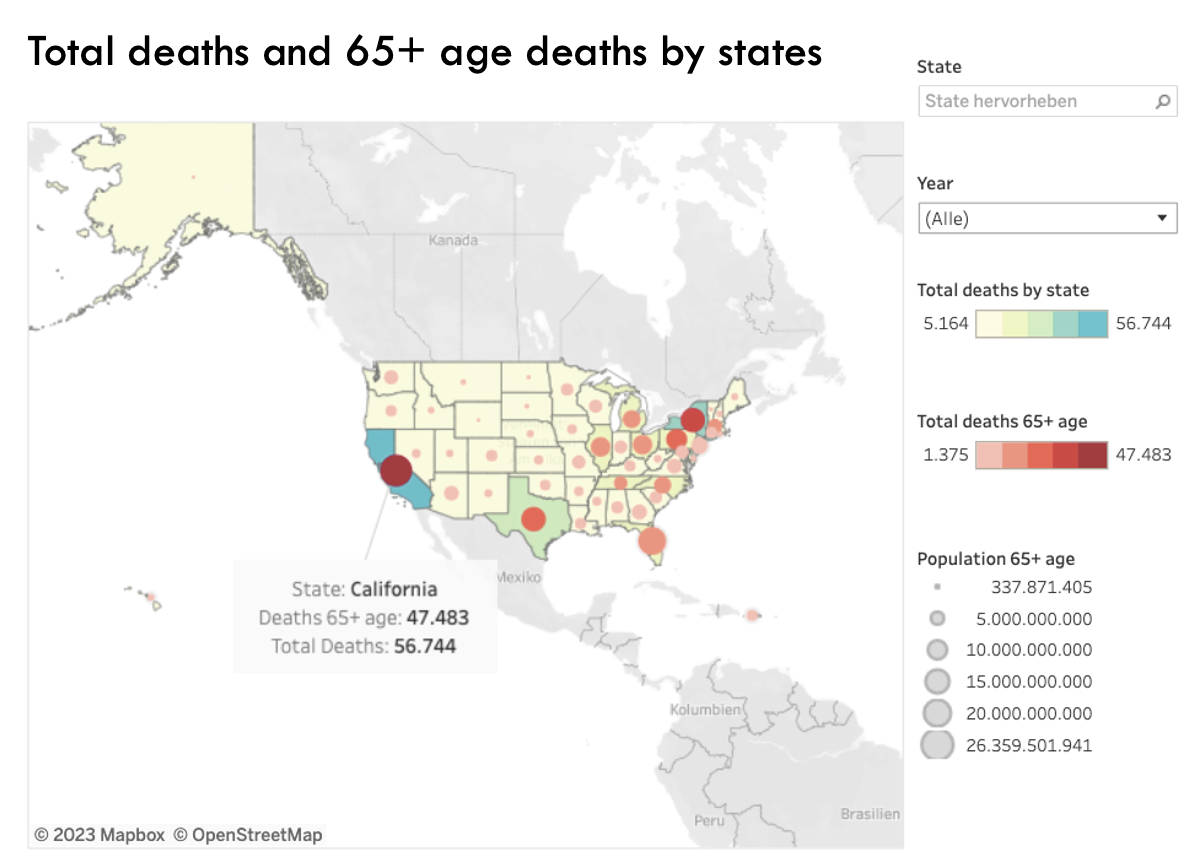
Which countries have the highest propotion of inlfuenza deaths?
California has the highest population propotion of 65+ years olds and therefore the highest average death rate. It is followed by New York, Texas, Florida and Pennsylvania.
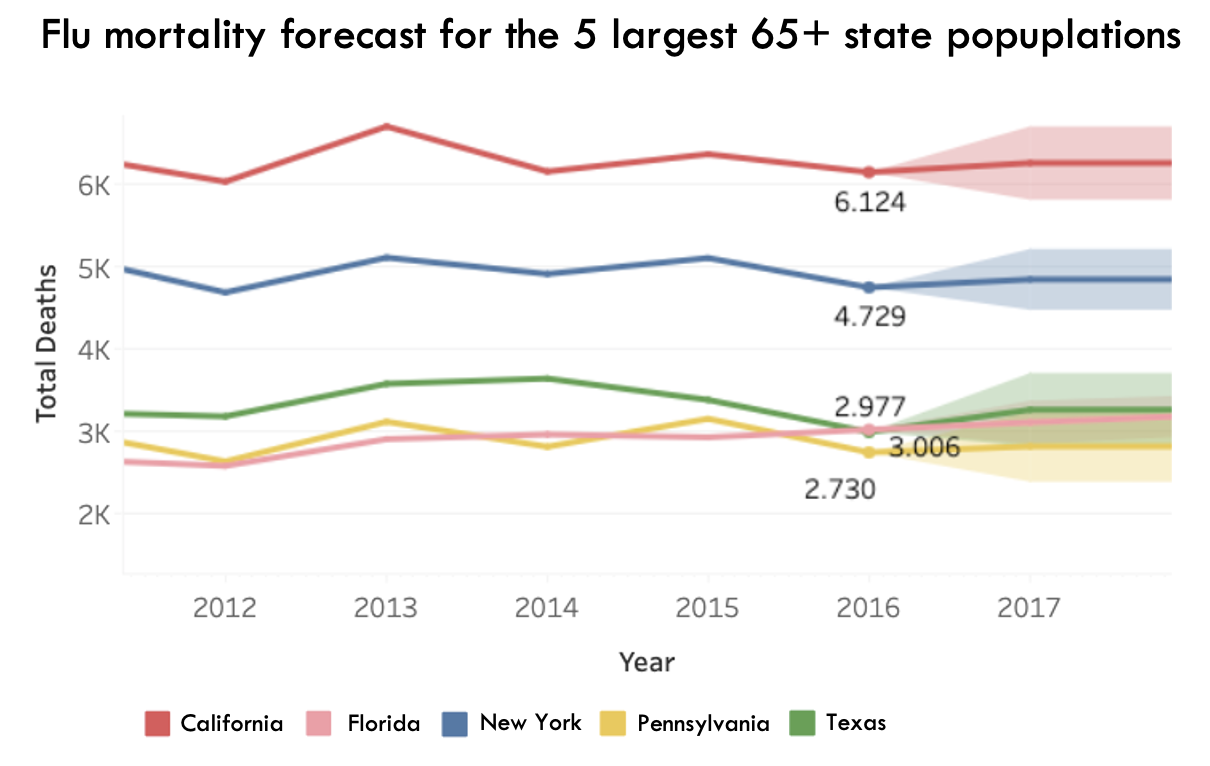
How high will be the expected inluenza death rate for 2018?
States with a high population propotion of 65+ years olds have a higher influenza death rate regardless of the year. Five of them are expected to suffer from at least 2,4K related flu deaths in 2018.
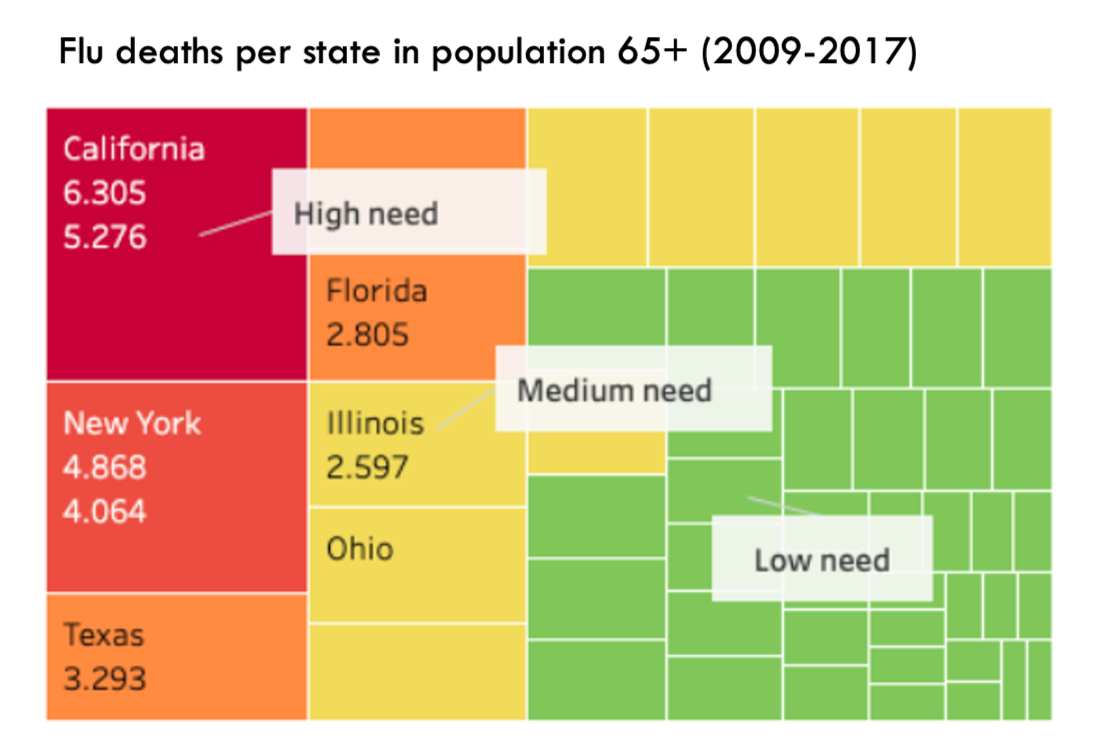
Where should the additional staff be sent to?
Therefore California, New York, Texas, Florida and Pennsylvania are in high need of additional medical staff. States like Illinois and Ohio have a medium need cocerning additional medical staff.